
Maltego graphs all start as a blank canvas. However, they often extend to include hundreds or even thousands of Entities. The larger the graph, the more challenging it is to analyze and understand its content. Of course, using Layouts or Search functions will allow you to grasp some information and better interpret your graph, but Views are the truly invaluable tool that will allow you to figure out what the data in your graph contains.
Layouts change how information is structured; Views change how Entities are displayed.
Take the graph containing a Bitcoin address linked with several hundreds of transactions for example.
In this example, we want to figure out what was the biggest transaction made on 04 June, 2021. Without the Views feature in Maltego (image left), we would have to copy all the transactions into a new graph, extract the date for each transaction, remove the ones that were not made on that day, and then extract the transaction amounts, followed by sorting the resultant amounts. Only at that stage would we be able to identify the largest transaction made on that particular day.
Instead, we can simply use a View to modify the size of transactions according to their amount, as well as their color according to the date the transaction took place (red for the 4th of June, black for any other day). This would give us the graph at the right.
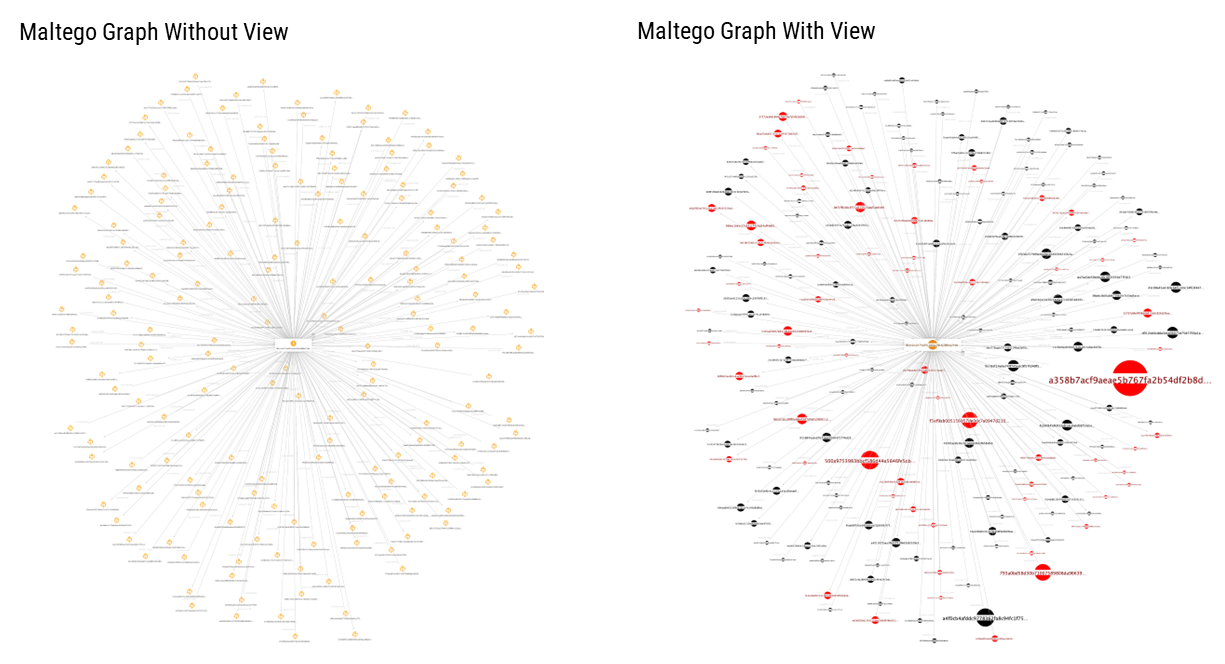
It now becomes clear that the transaction we are looking for is the one highlighted to the right of our graph.
Let’s dive into the topic of Maltego Views: How they work, when to use them, and how to harness their power to boost your investigations.
Part 1: Introduction to Views and the Basics of Setting Them Up Part 2: Writing Bindings for Your Views Part 3: Useful Tips for Leveling Up Your Bindings and ViewsMaltego Views and How to Use Them 🔗︎
When Should You Create A View in Maltego? 🔗︎
Views are very useful, but using Views requires more time and knowledge in comparison to running a simple search in your graph. Before creating a View, ask yourself: Could you simply use Ctrl+f and type a search query to satisfy your request?
For example, if you want to search for posts mentioning “Donald Trump” amongst your graph, the search bar is a quicker alternative to Views - especially one that will allow for selection of these posts as you search them. If you want to highlight posts that contain a keyword amongst a pre-existing list, a View could be considered rather than searching individual keywords.
Views are better used on datasets that are too large to have each Entity individually evaluated. For instance, if your graph has only 10 Entities, clicking every Entity would be faster than writing a View.
How Views Work 🔗︎
Views are nothing more than a collection of bindings executed one after the other on the Entities populating your graph. A binding is a JavaScript code snippet which will be executed using the eval function.
While having basic programming knowledge will make things easier, it is not required to write a binding. A lot of bindings can be adapted by modifying a few variables to fit your needs. This is the case with the default ones that you can find in every Maltego Desktop client, as well as the ones in this article.
Here is a simplified version of the binding controlling the size of the Entities in the previous example:
if (isType("maltego.CryptocurrencyTransaction")){
    if (hasProperty('total_input')) {
        getPropertyValue('total_input') * 50
    }
}
As you can see, it is very short:
- We check the type of the Entity
- We verify that it has the property total_input
- We obtain the value of that property and multiply it by 50.
Let us now dive into the process of creating a View!
Creating Your Views 🔗︎
To create a View, click on the Manage View button in the View tab at the top of your screen.
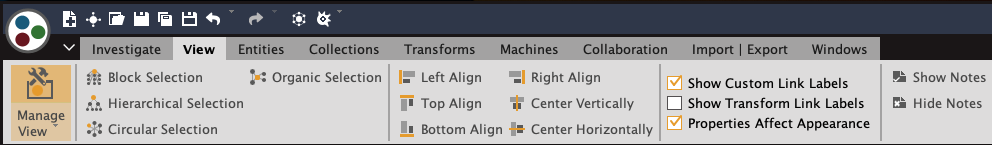
This will open the Manage View window. This is where you can create, remove and organize your Views.
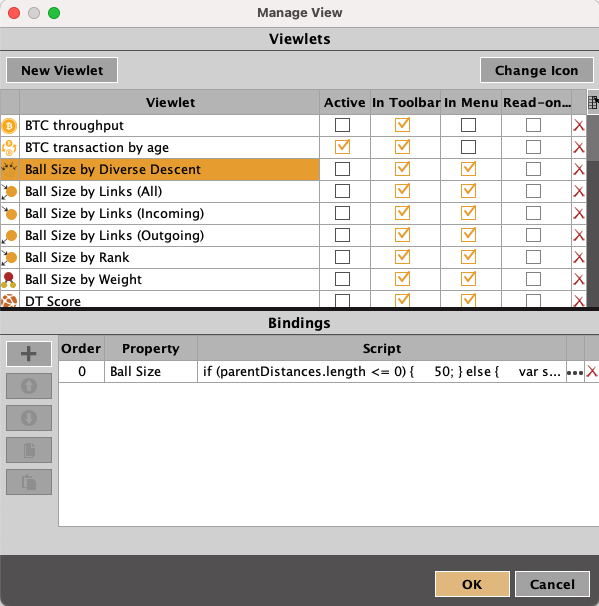
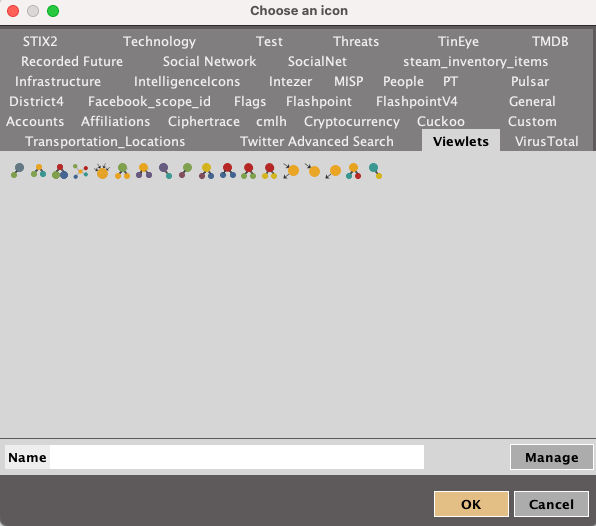
To add a new View, click on the New Viewlet button on the top left. After naming your new View, it will appear on the list of Viewlets. Select your Viewlet in the list and assign an icon to it by clicking on the Change Icon button on the top right. You will need to add an icon to your View to place it on the View taskbar.
After selecting an icon, you can tick the several boxes in the list to modify their place in the Maltego Desktop Client or activate them (see the previous image):
- Ticking the Active column uses the selected View to display the graph.
- The In Toolbar column allows you to display the Views on the left of your graph, below the layouts.
- The In Menu column will place the Views in the drop-down menu displayed when clicking Manage View button.
Now that we know how to create a View and place it into our Desktop Client, let’s learn to create bindings to make our Views more useful.
Creating Your Bindings 🔗︎
Bindings contain the actual code run by Maltego to display your graph according to your criteria. They can modify the size or the color of the Entities on your graph.
To add a binding, simply select a View in the Manage View window and click the plus button next to the Bindings section. This will take you to the window shown below:
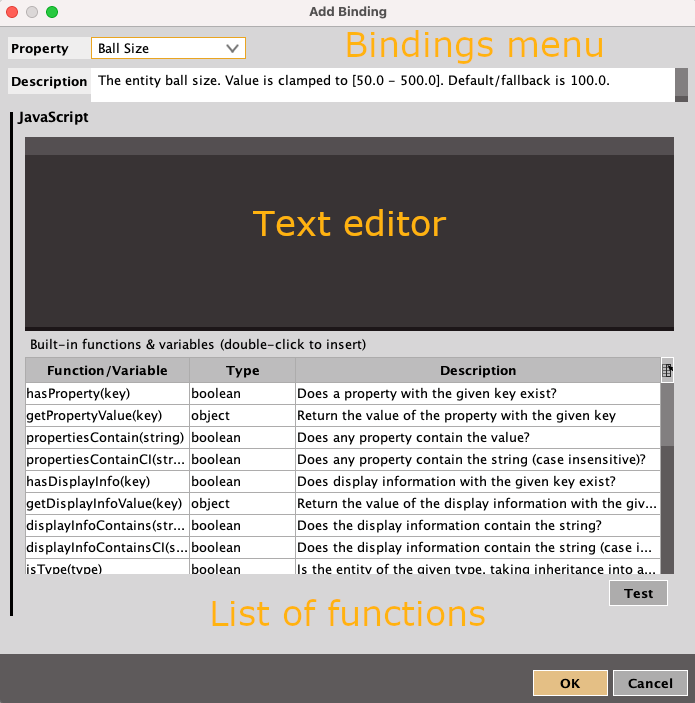
This is where you will add your code and choose what kind of binding you are writing.
Let’s take a look at this window:
- The Bindings Menu contains options that determine the Entity colors or sizes on your graph through the outputing of your code snippet.
- The Text Editor is where your code should be placed.
- Underneath is a list of functions that do not belong to JavaScript but are provided by Maltego to interact with the Entities in your graph.
Writing a View means using these functions to obtain information from the Entities to tell Maltego how to represent them. This list of functions is relatively simple and are organized around two main themes:
- The properties of an Entity: Properties, display information, notes, bookmark, type, etc.
- The links of an Entity: Incoming and/or outgoing
To write efficient Views, we need to understand how to use these functions. Part 2 of this blog article series will teach you how to do this, and then it will be up to you to learn some basic JavaScript to manipulate the information at hand to design Views. However, if your intention is to be able to create simple Views without the in-depth programming aspect, this article contains templates that you can easily modify to fit your needs.
Happy Investigating!