There are a multitude of different types of investigations that can be carried out in Maltego, some of which we have presented in previous articles. Our usual approach is to guide you through the primary steps of an investigation and offer some advice on how to advance your investigation and pursue further avenues of inquiry. However, real-life Maltego investigations do not take place in a vacuum, and their results often need to be shared, inside or outside of the organization for escalation and reporting purposes.
Hence, this article aims to guide you through Maltego’s export functionalities, allowing you to take full advantage of the features best suited to your type of investigation.
Generating Reports and Exporting Graphs in Maltego 🔗︎
In this article, we will introduce 5 report generating functions and 2 additional export options:
-
The Maltego Graph File [**. mtgl]
1. The Maltego Graph file [**. mtgl] 🔗︎
Strictly speaking, the Maltego Graph file is not an export function. Just as with any other software, Maltego has its own specific extension in which the resulting graphs from investigations can be saved and shared. The .mtgl extension is unique to Maltego and therefore, when sharing a graph, it is imperative that the team or persons viewing the graph have Maltego installed for this method to be of use.
Furthermore, the persons with whom you share the graph will be able to view all Entities contained even if they do not have access to the same Hub items that you do.
Saving a Maltego graph in the .mtgl extension is also particularly useful when working on long or complex investigations. Often, an analyst may find themselves at a crossroads or hitting a wall and in need to rethink their approach or strategy, yet they may still wish to preserve their current graph for future reference.
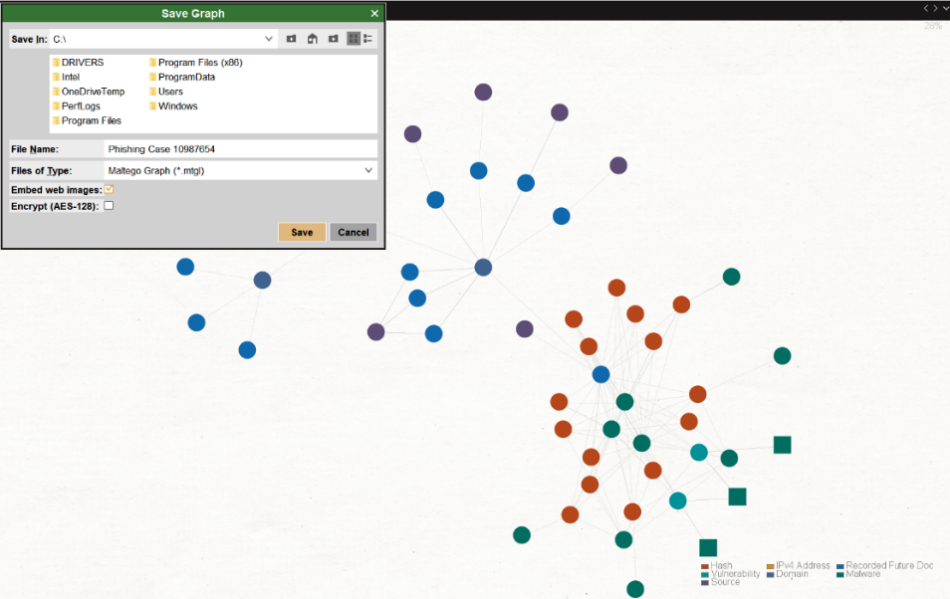
To save a graph like the one below, click on the Application button, select “Save as” from the drop-down options, assign a name to the graph file and hit the Save button.
2. Exporting a Maltego Graph to Tabular Format 🔗︎
There is no one-solution-fits-all in cyber investigations, and at Maltego we know that sometimes analysts need to export graphs to a tabular format for reporting purposes or to import data to other software or solutions. We made some upgrades to the export options in one of our previous releases, and Maltego now offers more flexibility in the representation of graph data in the tables.
Use Case: Exporting a Maltego Graph of a Phishing Investigation into Tabular Format 🔗︎
Let us refer back to the Maltego graph of a Phishing investigation. In an enterprise setting, this type of investigation could be triggered in several ways. One of them would be through an alert from the SIEM system generated by a suspicious online artifact such as an IP address. Your job as an analyst would be to determine if the IP address is indeed a malicious one or a false positive by analyzing the structure surrounding said IP address.
The result of this particular investigation in Maltego was the discovery of 113 CVEs linked to the Agent Tesla Keylogger and to the Emotet Malware. As an analyst, you would want to export the CVE numbers to a table and pass it onto the team responsible for vulnerability management for corroboration with their existing data, and to patch the applications that could be affected by said CVEs, thus preventing future exploits.
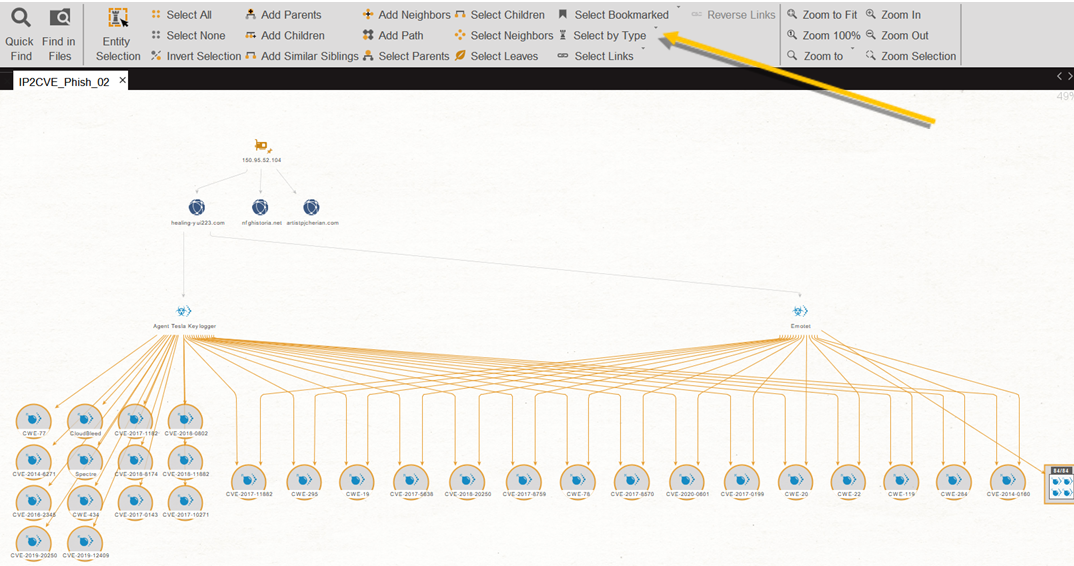
From within Maltego, the first step is to click on the Select by Type option from the Investigate tab, then click again on the Vulnerability option.
Once the Vulnerability Entities have been selected, you will need to head to the Import/Export tab and select the Export Graph to Table option to start the Graph Export Wizard.
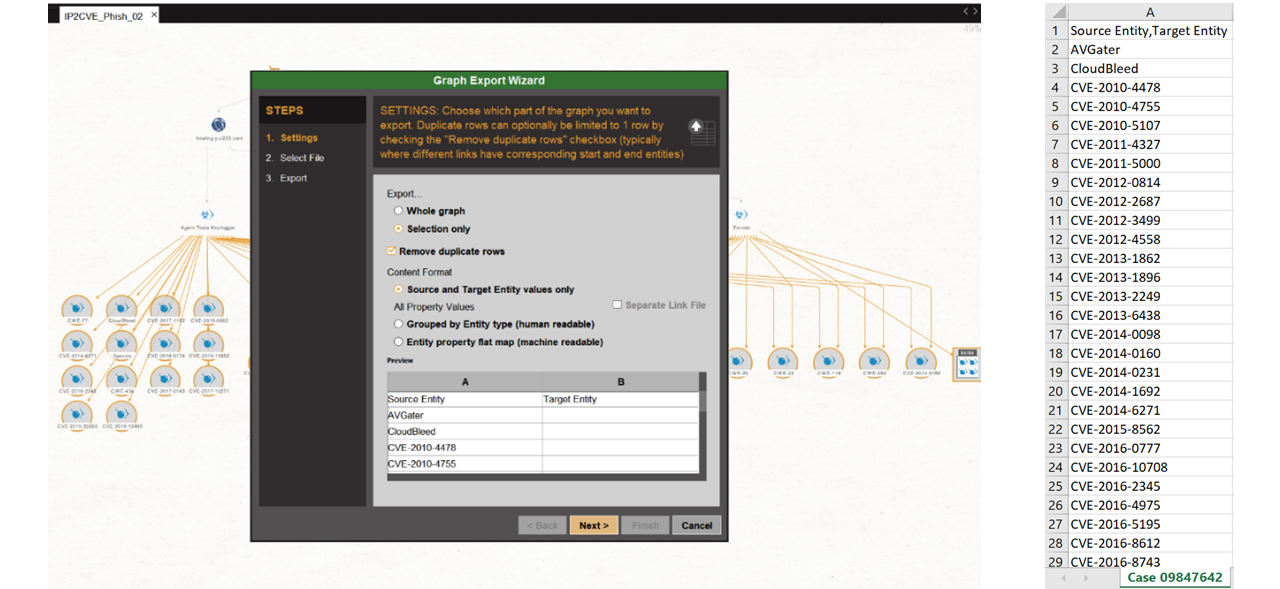
In the Graph Export Wizard, select the “Selection only” option and check the “Remove duplicate rows” checkbox to remove any duplicate rows you might have created on the Graph. Given that you only need to provide a list of CVEs, you can select the “Source and Target Entity values only” and click Next.
Name the export file, select your preferred location and extension (csv, xlsx or xls). The image below shows how the data would be displayed in the file under the above export conditions.
There are additional graph export options available with the Graph Export Wizard. exporting the Maltego graph to a table, you are also able to choose exporting the whole graph or just a selection thereof. This export method allows you to easily re-import your exported data again at a later stage using the Import an Exported Table option.
To learn more about the Export Graph to Table options, please refer to our documentation here.
3. Export your Maltego Graph as an Image file 🔗︎
Need to illustrate the results of your investigations for a report or simply share their Maltego graph with colleagues who do not have access to Maltego? Why take a screenshot when you can simply export either your whole Maltego graph or a section thereof to an image format? A section is especially useful when you want to zoom in on a big graph or show a specific cluster or set of Entities.
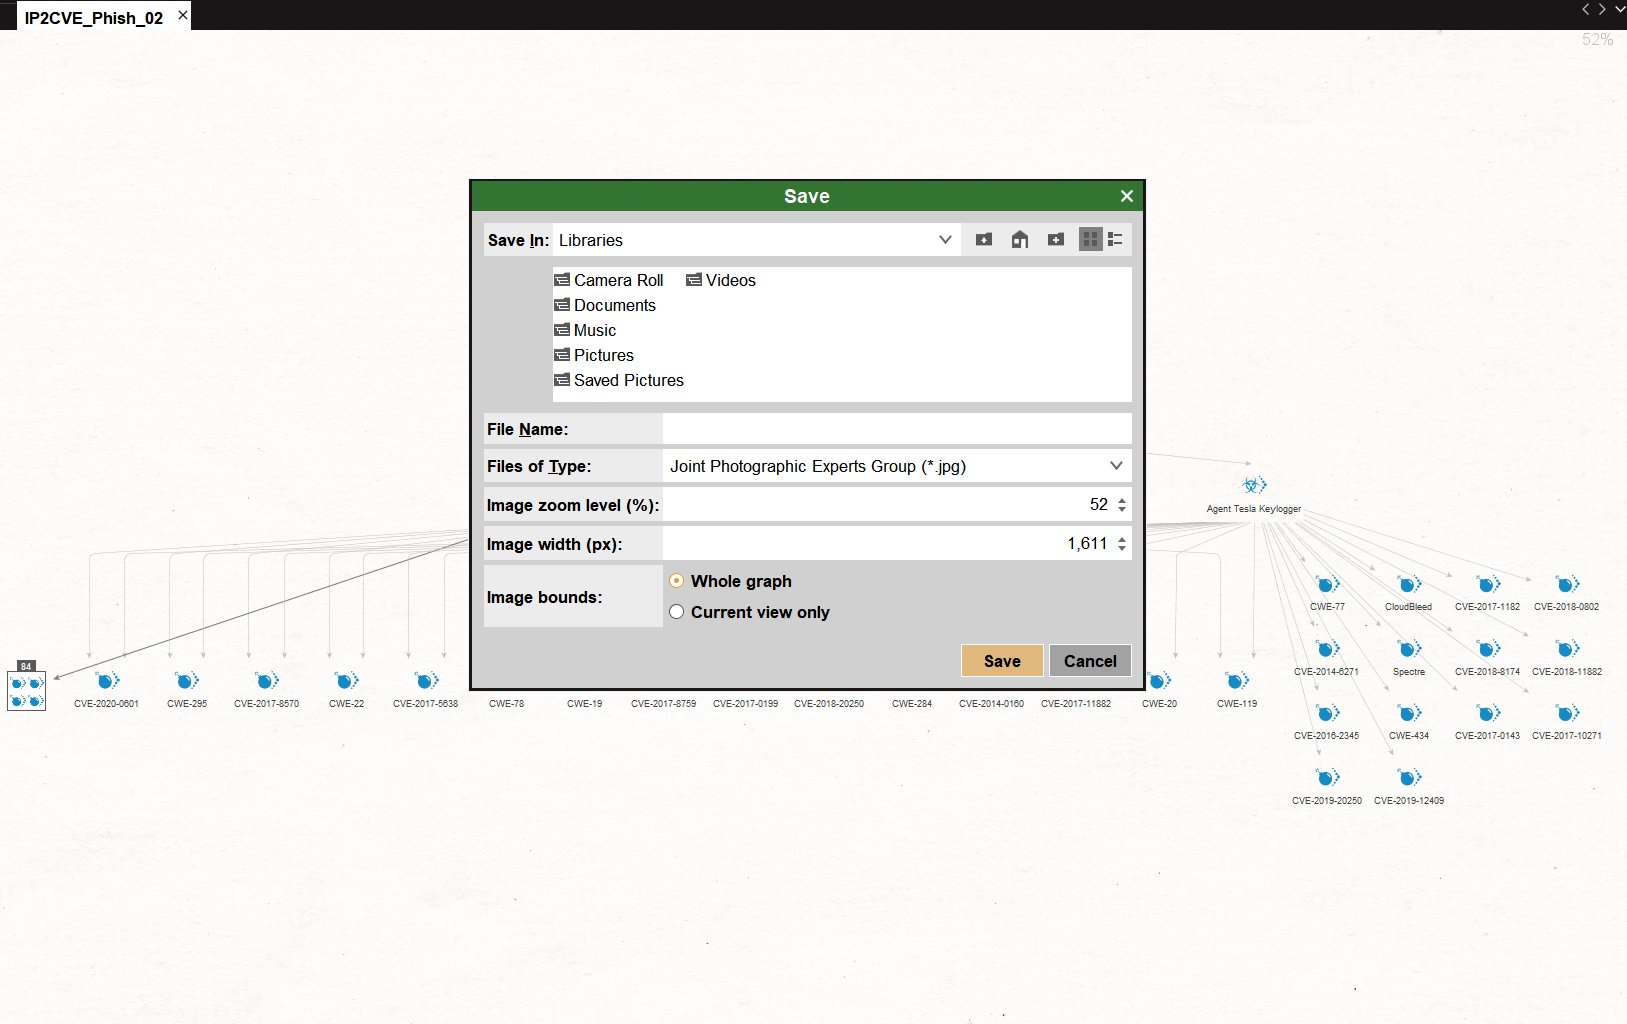
To do so, click on the Export Graph as Image option on the Import/Export tab, name your file and select your image format (png, jpg, bmp, or html). The “Tiled Browser Image” html format is recommended for large, complex graphs. This option generates a folder containing a scalable html file and tiled images, allowing you or the graph recipients to consider the essential points of very large graphs.
Be sure to select the appropriate image zoom levels and width. Maltego automatically calculates the pixels required to fit to your selected zoom level. Therefore, the higher the zoom level, the higher the resolution and quality of the exported images.
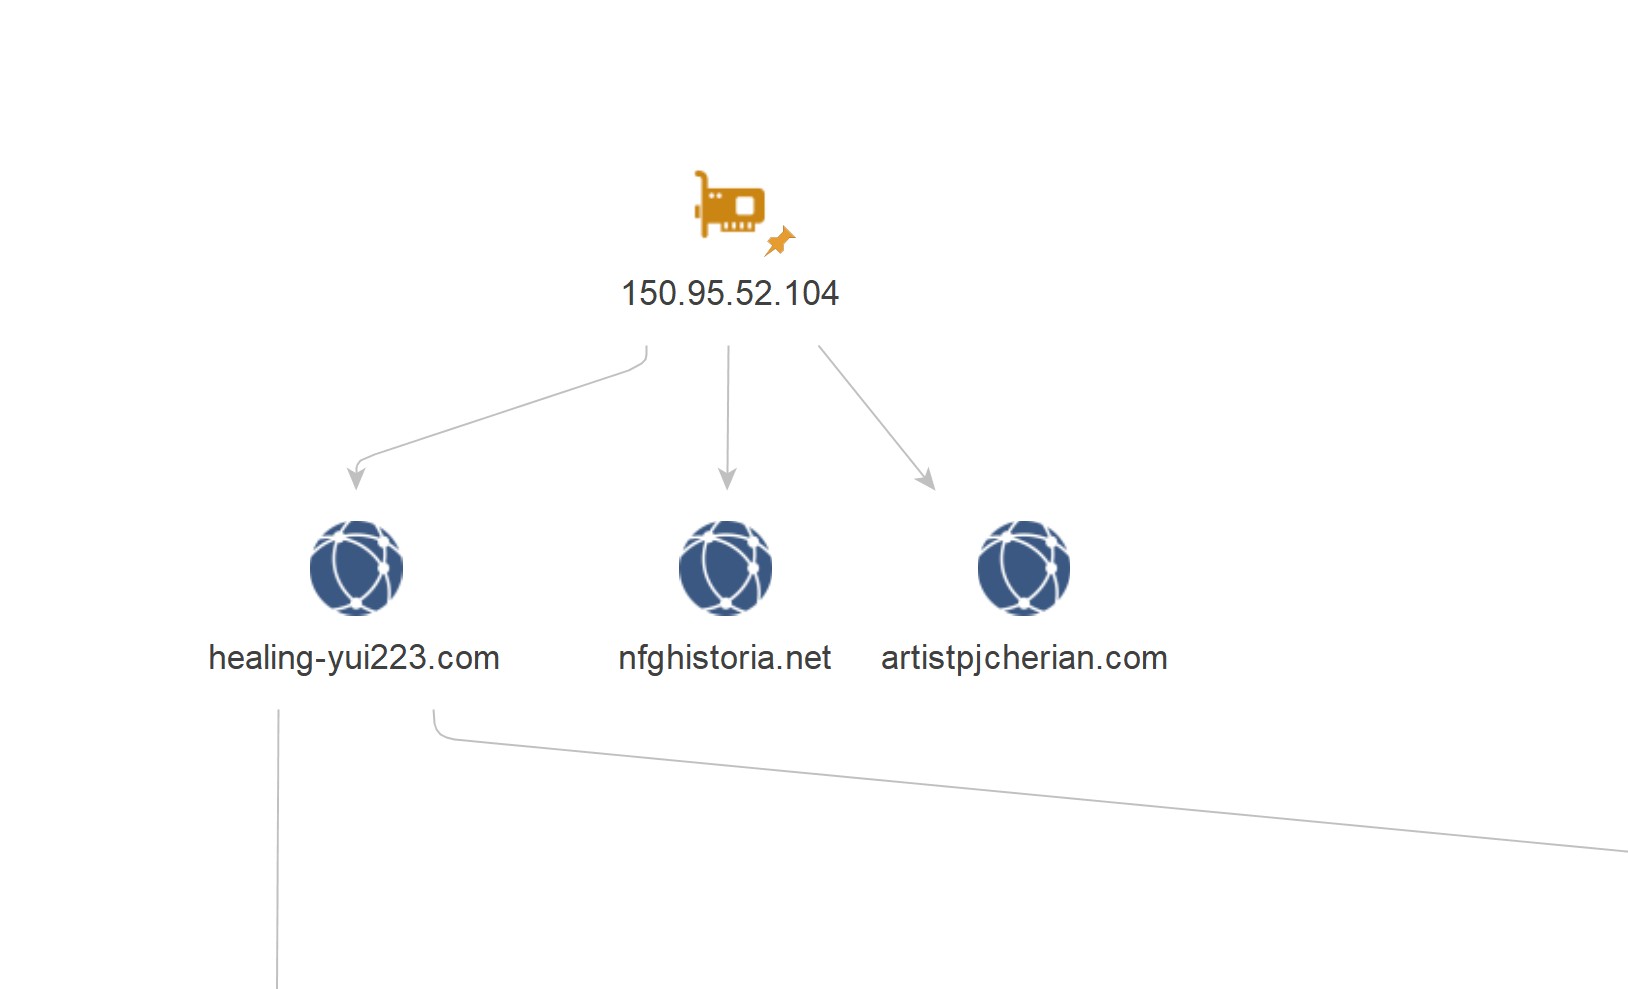
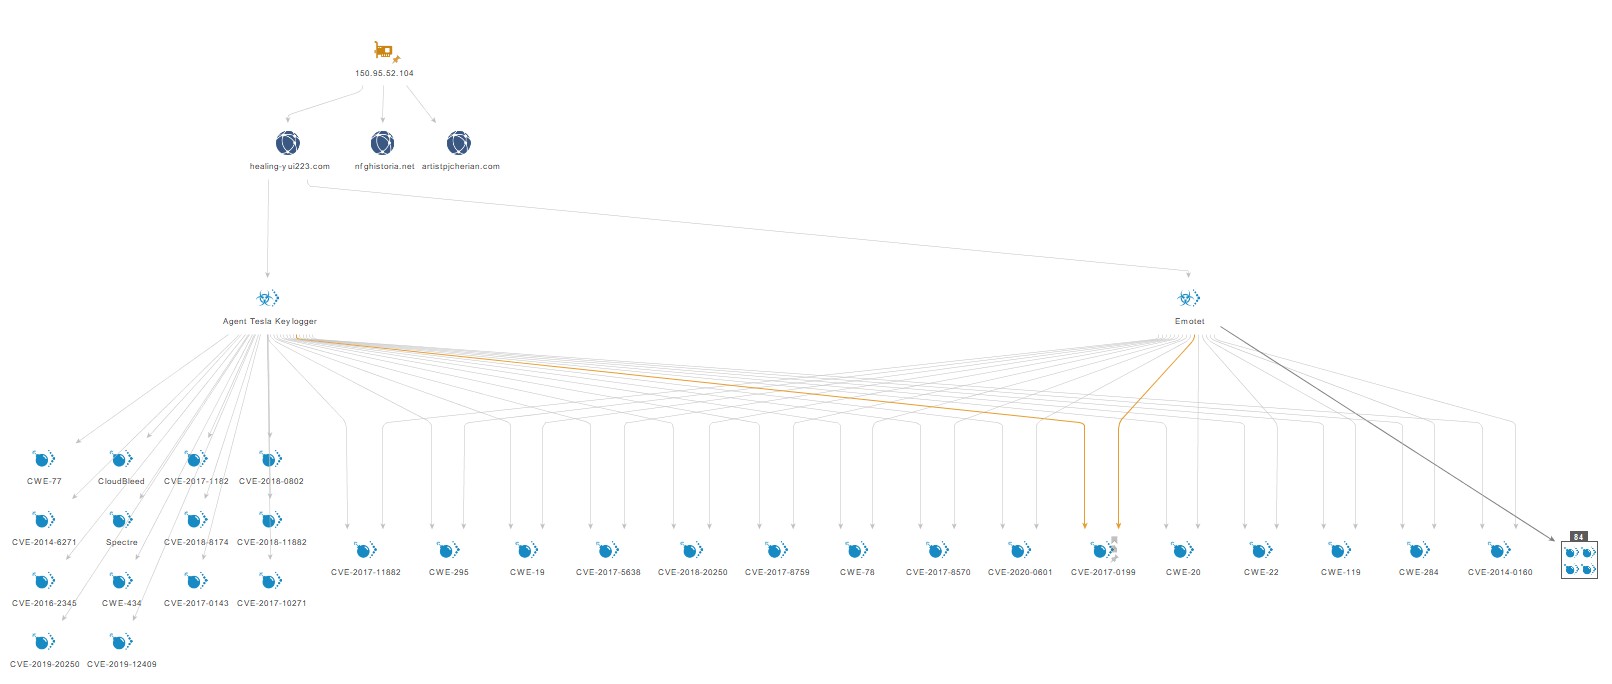
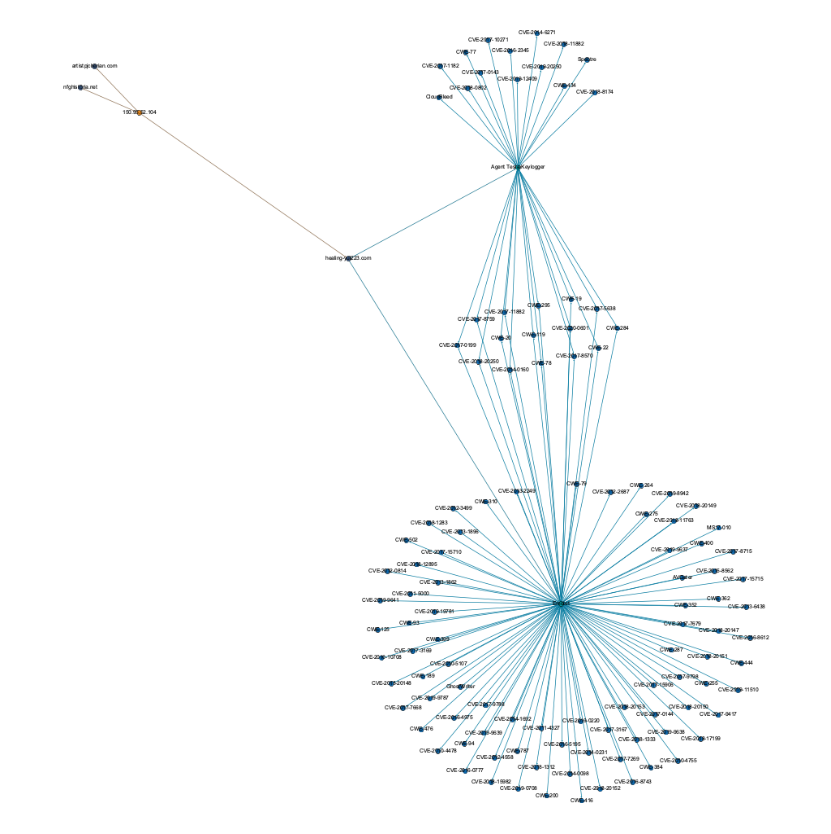
The images below show the results of our Export Graph as Image on a jpeg format. The first one shows a “current view” and the second one shows the whole graph.
4. Generating a Maltego Report 🔗︎
Analysts using Maltego often need to present and justify their findings to a colleague in a different team or to their supervisors in order to move the investigation process forward. As the degree of documentation required varies across organizations and functions, sometimes, the previous export options would be adequate to meet compliance and due diligence requisites.
However, some organizations may ask investigators to document and attach everything from website screenshots through the different stages of the investigation to full reports provided by the tools they used. Some organizations may still prefer to keep paper trails as well as digital formats of investigations. In these, and many other cases, generating a Maltego report is a must.
The Generate Report option in Maltego creates a PDF report containing all the information about the current graph in one document. Depending on the number of Entities and their attributes, the reports may become quite hefty and long. However, reports containing only a graph’s “current view” or zoomed-in view can be generated as well.
After clicking on the Generate Report option, select the destination folder, assign a name, and choose whether you prefer to produce a report containing the “current view” or the whole Maltego graph before you hit the Save button.
A Maltego report includes the following:
- Image of the Maltego graph (zoomed in or whole)
- Top 10 Entities ranked by incoming links, outgoing links, and total links
- A list of Entities categorized by their type
- A detailed list of the Entities, including all the information in the Property and Detail views of each Entity.
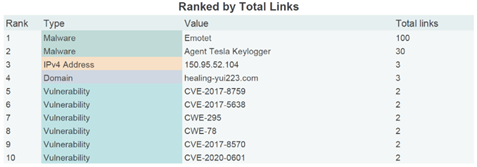
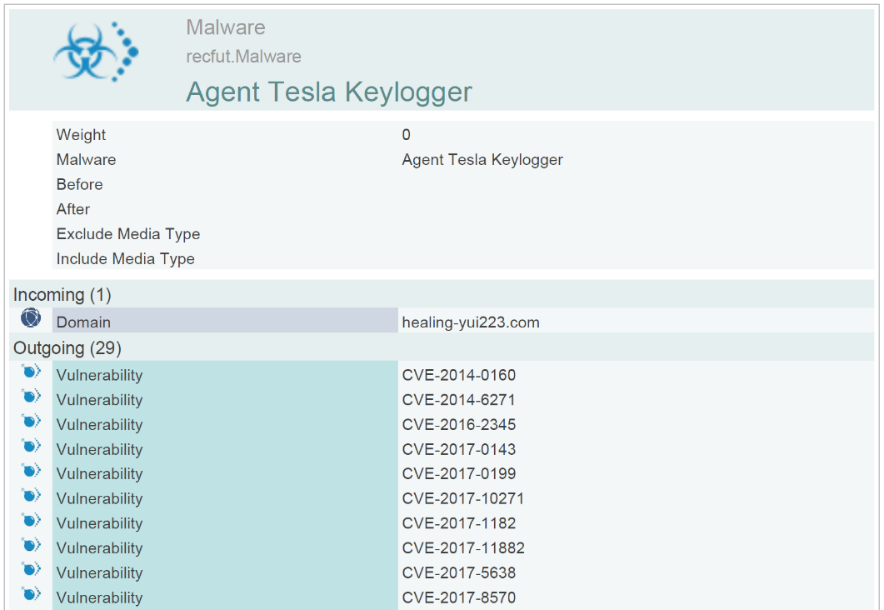
On the above image from the Maltego Report obtained from our phishing investigation, you can see the list of top 10 Entities ranked by the total number of incoming and outgoing links.
In the image below, you can see a portion of a detailed Entity view. Note that the amount of content shown in the first section varies depending on the Transform and data integration design.
5. Export your Maltego Graph as XML file 🔗︎
In addition to the previous export options, we offer the option to export a Maltego graphs as an XML file, namely a GraphML file. This feature allows investigators to bring the data contained in their Maltego graphs to other tools supporting GraphML formats, thereby making it possible to conduct further analysis.
There are multiple ways in which metadata can be stored in GraphML files, resulting in a lack of a standardized file type. For that reason, Maltego offers investigators three different options for exporting graphs as XML formats: Maltego GraphML, yEd GraphML, and Gephi GraphML.
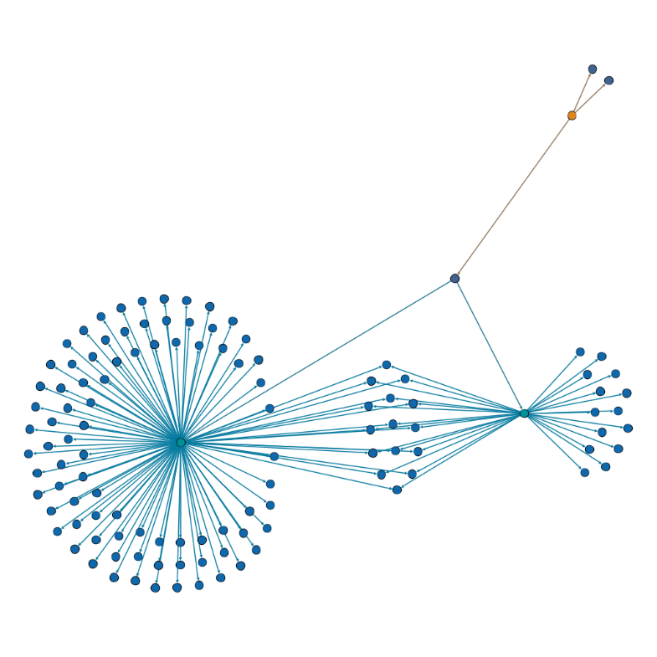
The previous images show the initial rendering of the Maltego GraphML file for Gephi, and a Gephi graph which includes Entity names.
Addtional Export Functionalities in Maltego 🔗︎
6. Export your Maltego Configuration 🔗︎
It is often necessary for analysts to showcase certain types of data in a very specific way and Maltego has made provision for this. You can configure certain elements of the Maltego UI such as the Entity viewlets and Entity overlay icons. To standardize and streamline analysts’ work, we have also added the Export Configuration feature.
With this feature, you are able to save all or specific configuration changes that you have made in Maltego for a particular type of investigation. Your configuration can then be shared with a team or persons for their own investigations. This also allows you to re-import your configurations as required back into Maltego.
7. Export your Entities 🔗︎
When you save a graph in Maltego, it automatically includes all the Entity specifications required by said graph. However, opening the graph in another instance of Maltego which does not yet know all or some of the Entities will present the user with an option to import the “new” Entity types.
There is also an option to share any customized Entities via the Export Entities feature located on the Entities tab, which will create a zip file .mtz containing the Entities.
Save Time Compiling Investigation Reports with Maltego 🔗︎
At Maltego, we do our best to provide the most comprehensive, powerful, and versatile tool for investigators and analysts worldwide. At the same time, we consider it our responsibility not to limit our users to our product, causing vendor lock-in. This is why Maltego offers a wide array of options to help satisfy your reporting needs.
To learn more about these export functionalities, please check our documentation or reach out to us at support@maltego.com.


 4.5 rating


