#madewithmaltego
Explore featured real-life investigations and use cases conducted by experts and analysts from the Maltego Community.
About #madewithmaltego: The Art of Investigations 🔗︎
As a graphical link analysis tool, Maltego mines, merges, and maps data relationships into graphs that are easy to analyze and share. Tracing the social media footprint of a person of interest or unveiling the criminal network behind a phishing attack, the resulting Maltego visualizations are not only useful, but also happen to be incredibly artistic.
We have crowdsourced some stunning graphs #madewithmaltego and the interesting investigative context behind them from the global Maltego community.
Explore these insightful use cases and submit yours for a chance to be featured here and on Maltego swag!
Explore Featured #madewithmaltego Investigations and Graphs Worldwide 🔗︎
Malware Infection 🔗︎
By PhishStats (@PhishStats), 2019
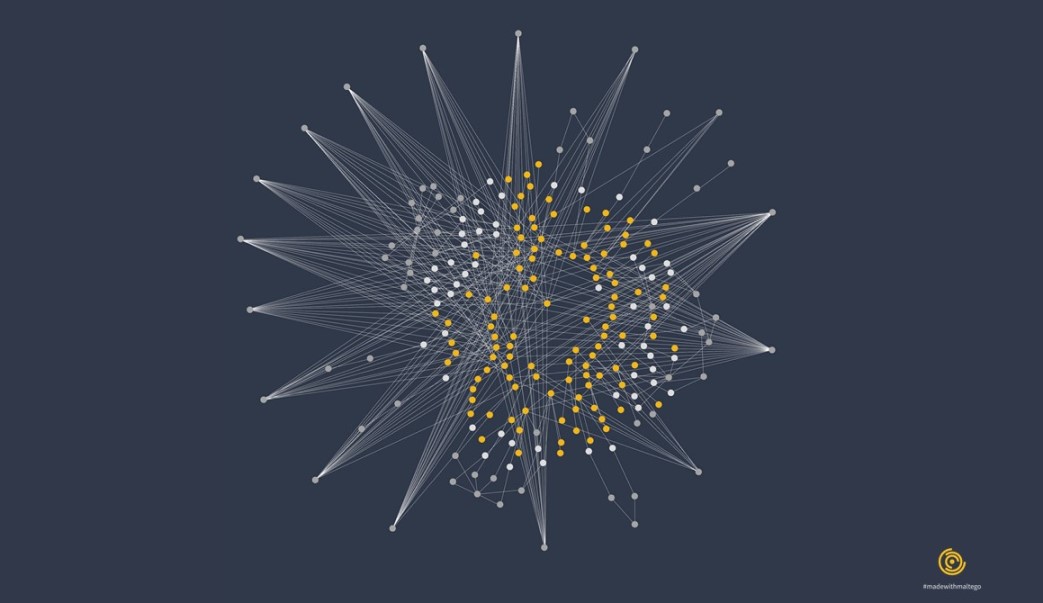
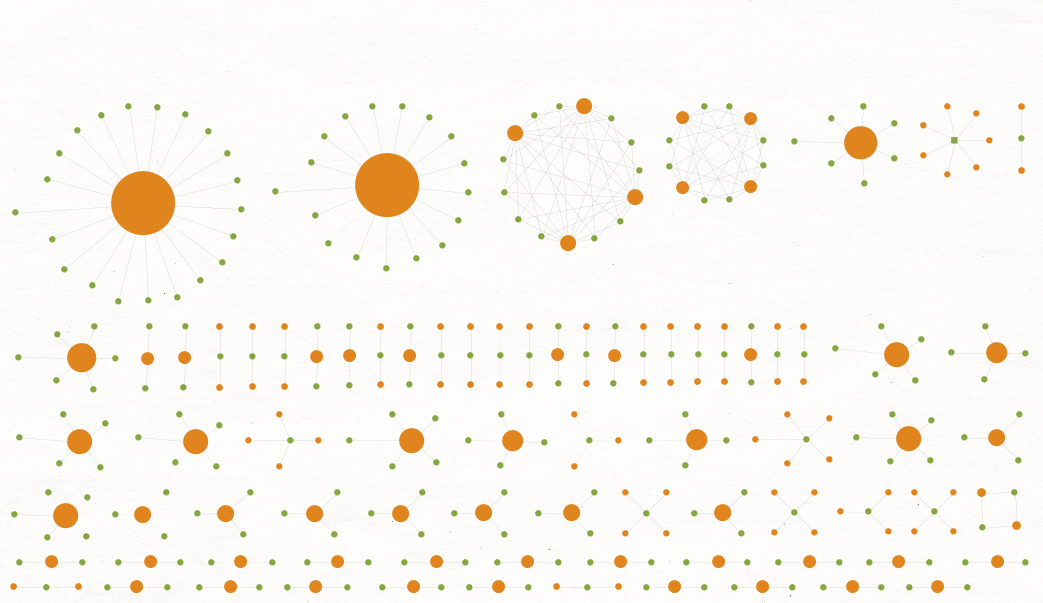
In this graph, @PhishStats uses Maltego to map the infection pattern of a small group of malwares and the affected companies and organizations. The result discovers how criminals modifies files attributes to avoid anti-virus detections.
Check out more of PhishStats’s work on Twitter or website: https://phishstats.info/
Criminal Investigations 🔗︎
By Daniel Card (@UK_Daniel_Card), 2020
In this graph, @UK_Daniel_Card looked into a breach involving a blocklist the criminals had deployed to evade being caught. He used Maltego to identify correlations and whether the hackers were hiding from specific organizations.
Check out more of Daniel’s work on Twitter!
Black Hats on Wikipedia 🔗︎
By James Alexander (@jamesofur), 2015
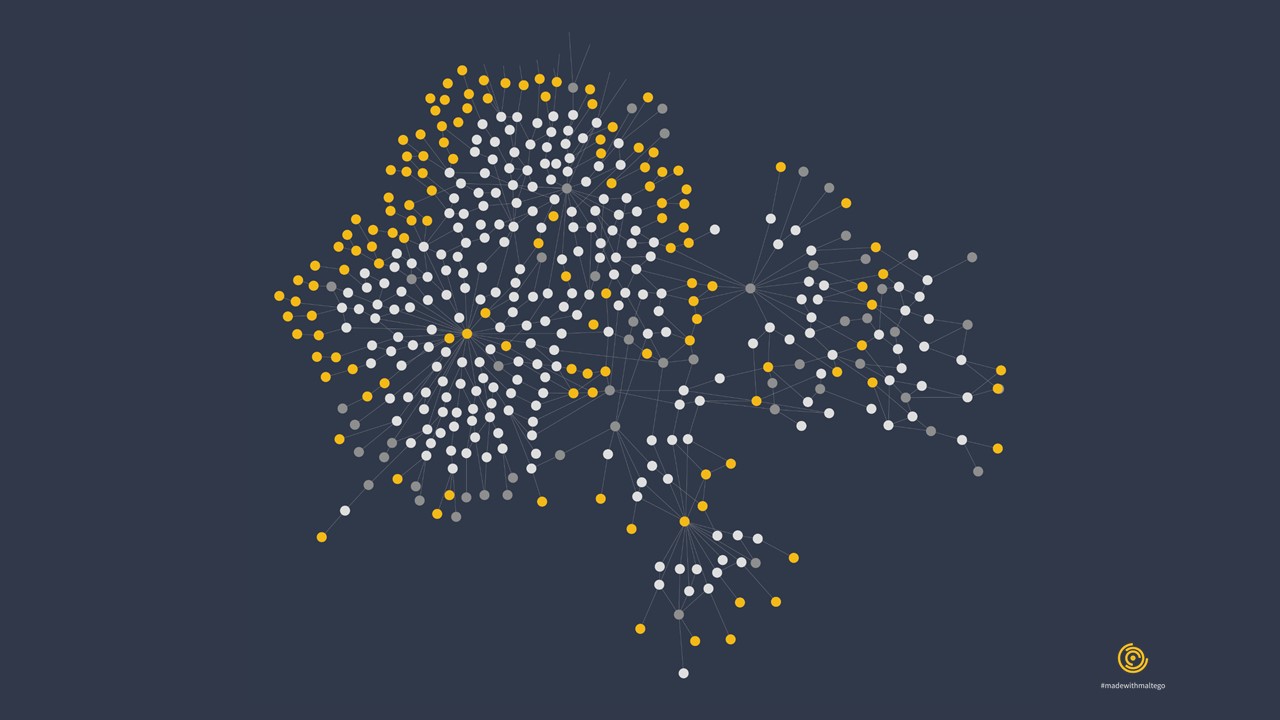
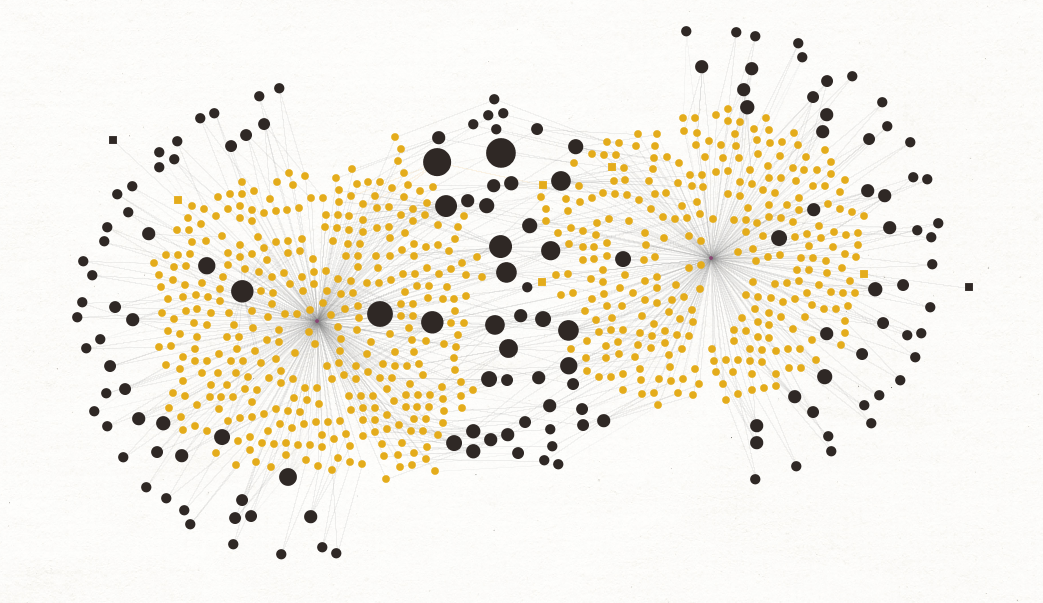
This Maltego graph depicts a sock-puppet investigation done in consultation with English Wikipedia functionaries, in which 381 black hat accounts on Wikipedia were identified and blocked for undisclosed paid advocacy. This graph by @jamesofur is freely licensed under CC-by-SA 3.0.
Phishing Websites 🔗︎
By PhishStats (@PhishStats), 2018
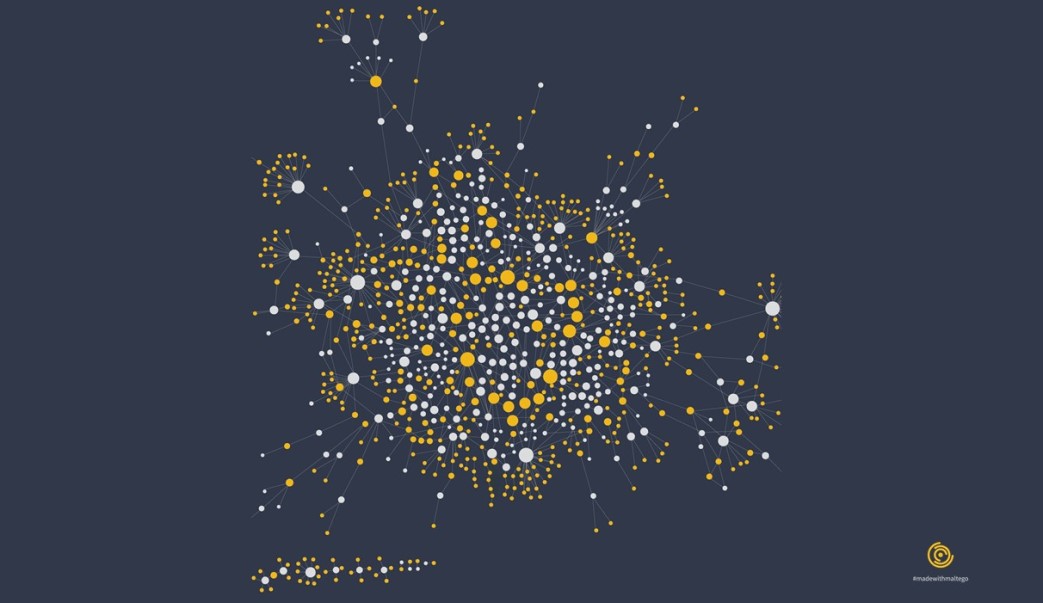
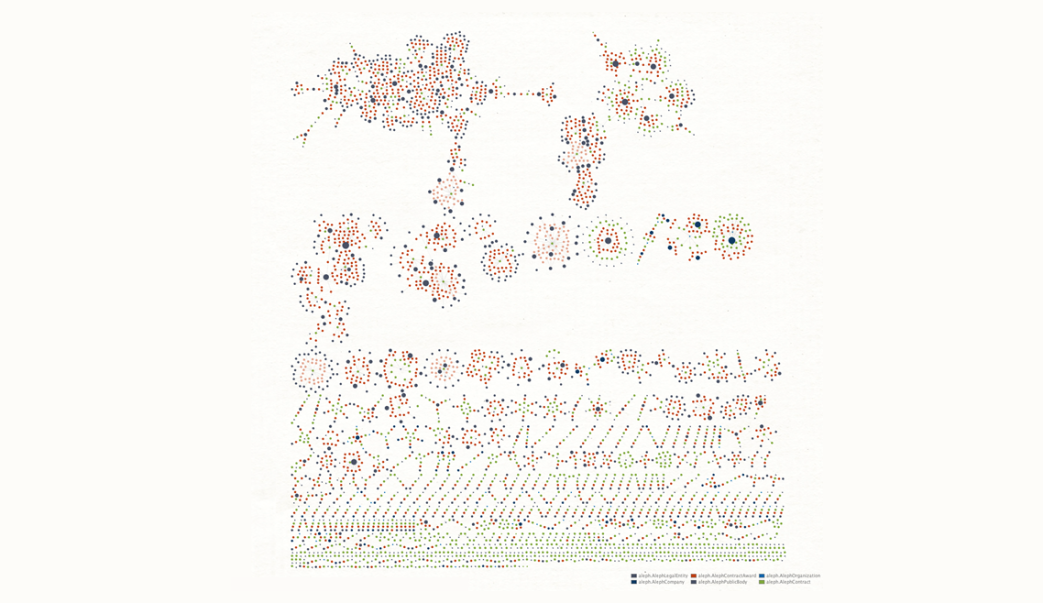
In this graph, @PhishStats uses Maltego to analyze 10,000 phishing websites. The data was exported from phishstats.info and loaded into Maltego using the proper correlation between the columns.
Check out more of PhishStats’s work on Twitter or website: https://phishstats.info/
SolarWinds Attack 🔗︎
By Dutch OSINT Guy Nico (@dutch_osintguy), 2021
In this graph, @dutch_osintguy looks into the 14,000 IPv4 addresses related to the Solarwinds APT hack, using breached data searches to identify individuals related to the IPv4 addresses and determine companies possibly involved.
Check out more of Nico’s work on Twitter!
Vulnerabilities of IoT 🔗︎
By Roy Boetticher, 2020
Shodan Transforms allow Maltego users to investigate global IoT and infrastructure data. In this graph, Roy Boetticher uses the Shodan Transforms to find servers hosting IPs that are mostly affected by vulnerabilities targeting VPN usage since COVID-19.
Check out Roy Boetticher’s website: https://www.royboetticher.com/
COVID-19 Phishing Domains 🔗︎
By Tendai Marengereke (@marengz), 2020
In this graph, Tendai investigates on 1,200 vetted COVID-related phishing domains from the COVID-19 Cyber Threat Coalition (CTC) database. The graph shows multiple websites sharing the same IP addresses, indicating direct relationships.
Spidering A Website 🔗︎
By Roy Boetticher, 2020
This graph is a result from Roy Boetticher’s demonstration of discovering internet relationships with only two Maltego Standard Transforms. The Transforms scrap the HTML of a webpage to find all visible and hidden backlinks.
Check out Roy Boetticher’s website: https://www.royboetticher.com/
Cryptocurrency Transactions 🔗︎
By Adam Maxwell (@catalyst256), 2020
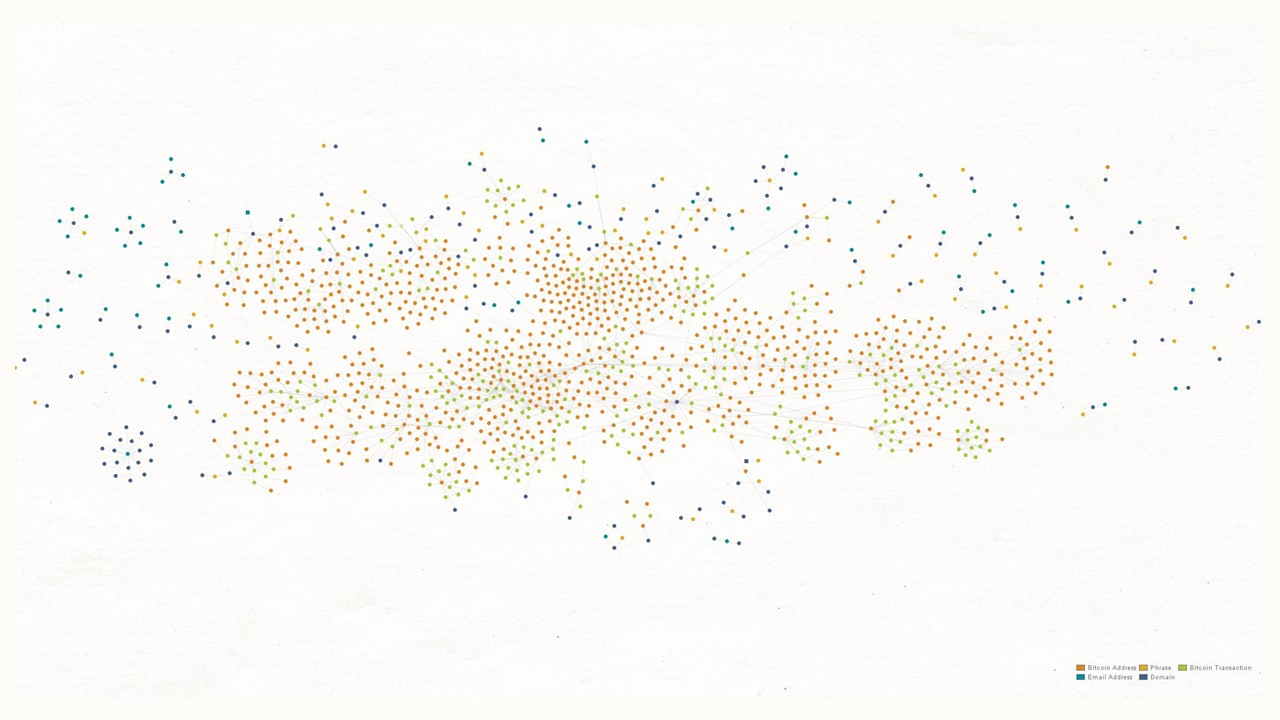
In this graph, Adam (@catalyst256) imported dark web data into Maltego and mapped out the use of bitcoin wallets and their transactions amongst hidden servers.
Check out more of Adam’s work on Twitter!
Network Footprint 🔗︎
By The Maltego Team (@MaltegoHQ), 2020
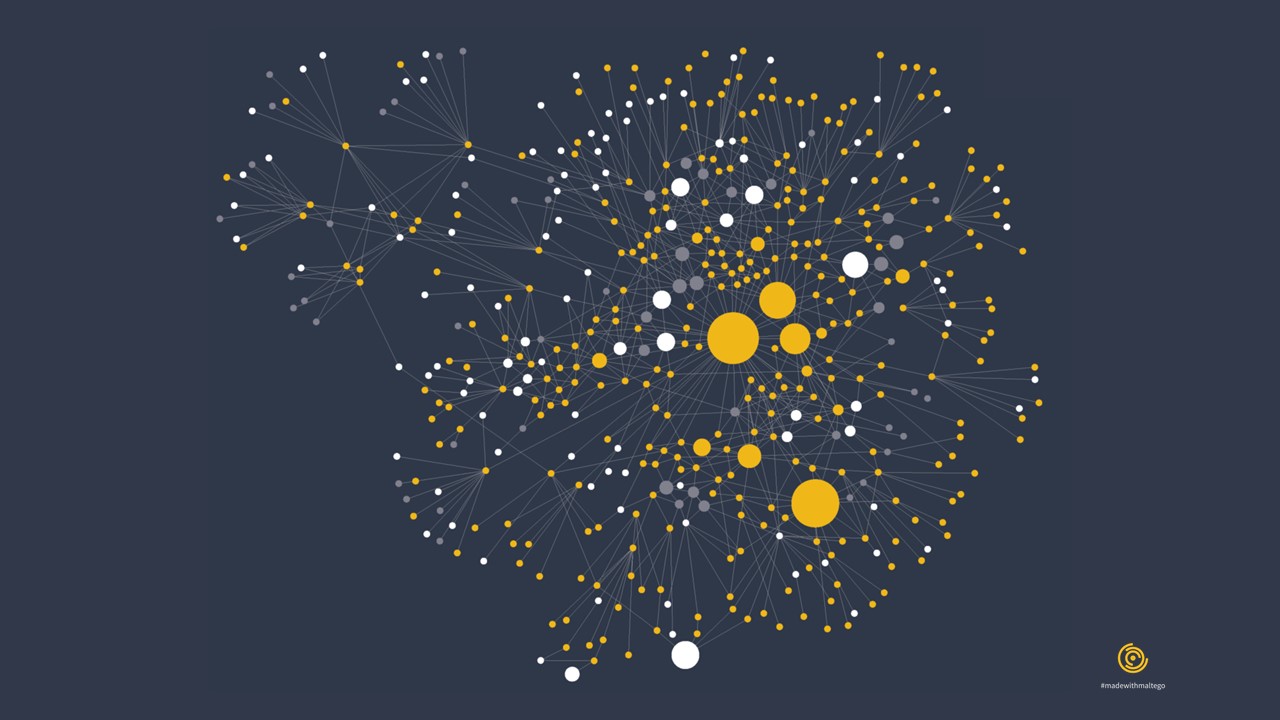
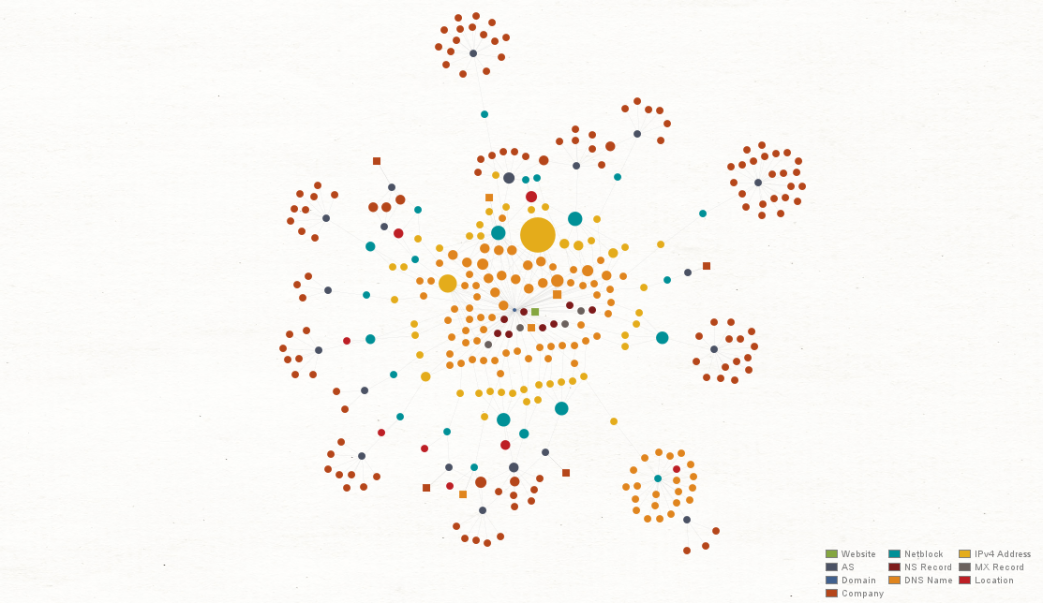
This graph shows the result of a comprehensive network footprinting process following Maltego’s network footprinting methodology. In this graph, Entity size is adjusted and displayed based on the number of incoming links, showing the most and least connected parts of a network.
Win Your #madewithmaltego Prize! 🔗︎
In honor of Cybersecurity Awareness Month in October, we are excited to launch the #madewithmaltego competition. Submit your Maltego graphs and investigation stories to us for a chance to be featured, win a Maltego license, or receive customized Maltego artwork!
How to Join The #madewithmaltego Competition? 🔗︎
- Share your Maltego graph and a short explanation of the investigation on Twitter
- Use the hashtag #madewithmaltego in your Tweet
- Don’t forget to tag us (@MaltegoHQ) in the Tweet
If we find your work interesting, our team will reach out via Twitter. If you have any questions, simply email us at marketing@maltego.com!
What are The #madewithmaltego Prizes? 🔗︎
- First Place: Maltego One license
- Second Place: Maltego Artwork—Your Maltego graph on posters or T-shirts!
- Third Place: Special feature on our homepage and social media channels
- Honorary: Retweet and shoutout on Twitter

